
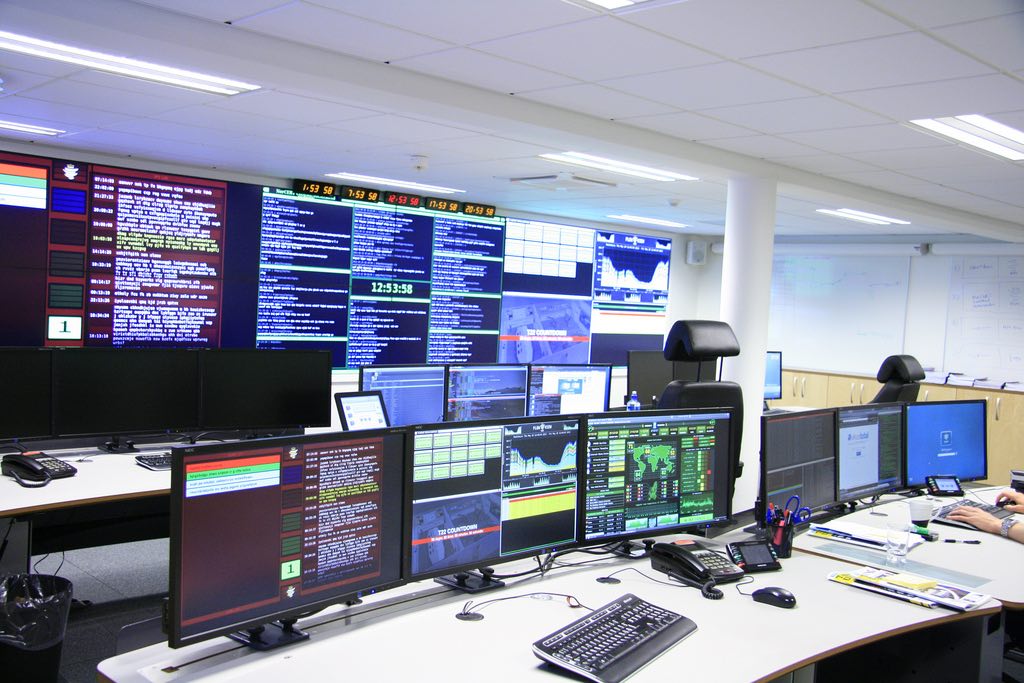
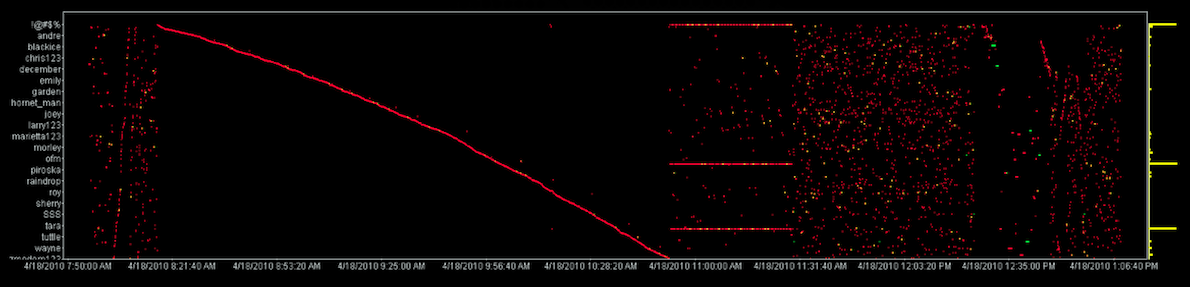
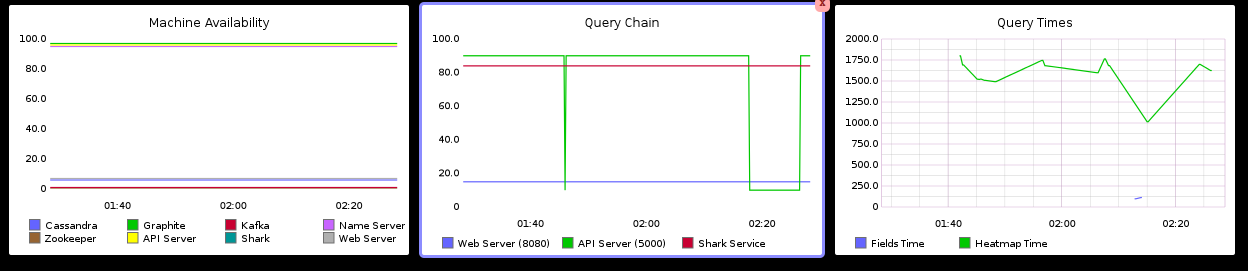
I just wrote a short blog post about how to get value and use out of your large SOC (security operations center) screens. I have seen too many SOCs that have CNN running on the screens and whenever customers or executives walk in, they quickly switch over to some kind of meaningless world maps that look kind of sexy, but have no security relevant purpose at all. From a security analyst's perspective, it is really not very useful to know from where across the globe most of the network packets are hitting our network. All those sexy looking attack maps really don't have that much value. Well, they can be sexy and provoke conversations. But there are ways to get more out of your expensive screens. Read how:
Dashboards in the Security Opartions Center (SOC)
I need your help!
I am looking through an old log file of a server with IP address 195.141.69.45 that I operated in 2002. The machine was running SuSE linux 6.0 (i386). It ran bind (9.1.0), sendmail (8.11.2), and was mainly used as a SMTP server to send mails for a number of users. I found these logs from my pf firewall that was in front of the box:
Oct 21 06:06:58.096785 rule 57/0(match): pass in on xl1: 195.141.69.45.1030 > 61.215.160.253.53: 2520 [1au][|domain] (DF)
Oct 21 06:06:58.401472 rule 57/0(match): pass in on xl1: 195.141.69.45.1030 > 210.175.50.163.53: 16979 [1au][|domain] (DF)
Oct 21 06:07:00.407500 rule 57/0(match): pass in on xl1: 195.141.69.45.1030 > 210.175.50.162.53: 47817 [1au][|domain] (DF)
Oct 21 06:07:02.417637 rule 57/0(match): pass in on xl1: 195.141.69.45.1030 > 61.215.160.254.53: 34849[|domain] (DF)
Oct 21 06:07:11.298946 rule 57/0(match): pass in on xl1: 195.141.69.45.1030 > 204.123.2.19.53: 20792 [1au] MX? www.com.ar. (39) (DF)
Oct 21 06:07:11.477536 rule 57/0(match): pass in on xl1: 195.141.69.45.1030 > 200.10.202.3.53: 21611 [1au] MX? www.com.ar. (39) (DF)
Oct 21 06:07:11.804894 rule 57/0(match): pass in on xl1: 195.141.69.45.1030 > 200.68.93.195.53: 21263 [1au] MX? www.com.ar. (39) (DF)
Oct 21 06:15:19.667120 rule 57/0(match): pass in on xl1: 195.141.69.45.1030 > 194.83.244.131.53: 60127 [1au] MX? sticksandstones.co.uk. (50) (DF)
Oct 21 06:15:19.691967 rule 57/0(match): pass in on xl1: 195.141.69.45.1030 > 212.62.7.30.53: 58792 [1au] MX? sticksandstones.co.uk. (50) (DF)
Oct 21 06:20:00.844472 rule 57/0(match): pass in on xl1: 195.141.69.45.1030 > 192.12.94.30.53: 29396 MX? about.com. (27) (DF)
Oct 21 06:20:00.859900 rule 57/0(match): pass in on xl1: 195.141.69.45.1030 > 205.151.222.254.53: 14698[|domain] (DF)
Oct 21 06:20:01.021076 rule 57/0(match): pass in on xl1: 195.141.69.45.1030 > 207.126.123.236.53: 13317 [1au] MX? about.com. (38) (DF)
Oct 21 06:20:01.070317 rule 57/0(match): pass in on xl1: 195.141.69.45.1030 > 65.214.161.5.53: 14337 [1au] MX? mx13.crazed.com. (48) (DF)
Oct 21 06:21:02.121813 rule 57/0(match): pass in on xl1: 195.141.69.45.1030 > 192.33.14.30.53: 34672 MX? poetic.com. (28) (DF)
Oct 21 06:21:02.297033 rule 57/0(match): pass in on xl1: 195.141.69.45.1030 > 216.21.234.76.53: 25081 [1au] MX? poetic.com. (39) (DF)
As you can see, there are a number of DNS lookups. They span a total of about two weeks and ALL of them are using a source port of 1030. Why 1030? Why is it fixed all the time? Shouldn't the source port change?
There are other logs intermixed, where DNS lookups happen from other source ports:
Oct 13 20:46:03.915405 rule 184/0(match): pass in on xl1: 195.141.69.42.63994 > 193.192.227.3.53: 60676+[|domain]
Those are normal and I completely understand those. Any ideas why all these others have 1030 as a source port?
![]() After 6 years, we finally have a new version of DAVIX available. It was about time to get this distro updated to modern standards. Ubuntu Server 13.10 as the base OS, github scripts to update your own systems, a Virtual Image you can download, new tools, etc.
After 6 years, we finally have a new version of DAVIX available. It was about time to get this distro updated to modern standards. Ubuntu Server 13.10 as the base OS, github scripts to update your own systems, a Virtual Image you can download, new tools, etc.
DAVIX, a live CD for data analysis and visualization, brings the most important free tools for data processing and visualization to your desk. Avoid the hassle of installing an operating system or struggling to build and compile the necessary tools to get started with visualization. You can completely dedicate your time to data analysis.
Now go download it!
This is the last post in the series of links for the Visual Analytics Workshop. This section lists a few resources on security and visualization.
Looking for the rest of links for the workshop?
- Introductionary Links
- Data Sources
- Data Processing
- Log Management and SIEM
- Big Data
- Visualization
- Visualization Tools
Wanna know more about the visualization workshop? Email me or visit http://pixlcloud.com/training
The section probably most anticipated during the Visual Analytics Workshop is probably the one where we get hands-on exposure with a number of visualization tools. We look at both actual tools and programming libraries. Here we go:
R
- R Cheat Sheet
- ggplot2
These are the tools and libraries we discuss during the workshop. Obviously, there are many more libraries and tools that I like to use in my daily work. But that will be a separate post at some point in the future.
Looking for the previous list of links for the workshop?
- Introductionary Links
- Data Sources
- Data Processing
- Log Management and SIEM
- Big Data
- Visualization
Wanna know more about the visualization workshop? Email me or visit http://pixlcloud.com/training
Next up: Visualization, the sixth module of the Visual Analytics Workshop. Note, this section is mostly content from books and not related to many Web-based resources that could be linked here. Hence kind of a short collection.
Looking for the previous list of links for the workshop?
- Introductionary Links
- Data Sources
- Data Processing
- Log Management and SIEM
- Big Data
Wanna know more about the visualization workshop? Email me or visit http://pixlcloud.com/training
Next up: Visualization Tools
I had the pleasure of attending the Underground Economy Conference this year in Bucharest, Romania. I ran a 90 minute workshop on big data and visualization. The workshop covered a number of tools, such as:

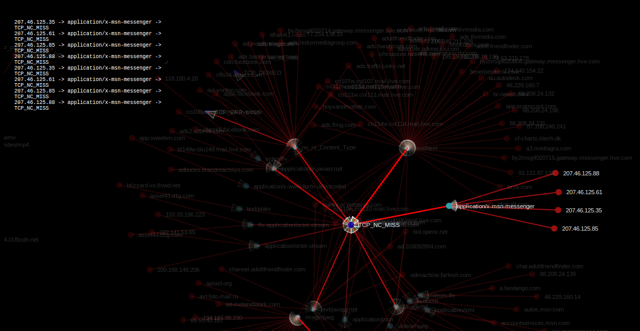
Firewall log where nodes encode the source and destination machines. The edge colors encode the port used for the communication. Graph was created by using AfterGlow and Gephi for the rendering.
On the left hand side, you can see DNS traffic, the brown part. The red edges denote SMTP traffic.

http://tnv.sourceforge.net/
This next module of the Visual Analytics Workshop is about Big Data. And here are the links that show up during this section. Keep in mind that especially this module is constantly evolving and has in the last months. New sections and links will be added to the training class very frequently.
Looking for the previous list of links for the workshop?
- Introductionary Links
- Data Sources
- Data Processing
- Log Management and SIEM
Wanna know more about the visualization workshop? Email me or visit http://pixlcloud.com/training
NEWS UPDATE! Next Visual Analytics Workshop to be held at BlackHat US in August. Join!
This is the Labor Day issue of the link collection series. The third module of the Visual Analytics Workshop is about Log Management and SIEM.
Log Management Tools
- Snare
- NXLog
- rsyslog
- syslog-ng
- rsyslog configuration wizzard
- swatch
- tenshi
- ossec
- ossim
- lasso
- logsurfer
Looking for the previous list of links for the workshop?
- Introductionary Links
- Data Sources
- Data Processing
Wanna know more about the visualization workshop? Email me or visit http://pixlcloud.com/training
Stay tuned for the next link collection which will be on big data!

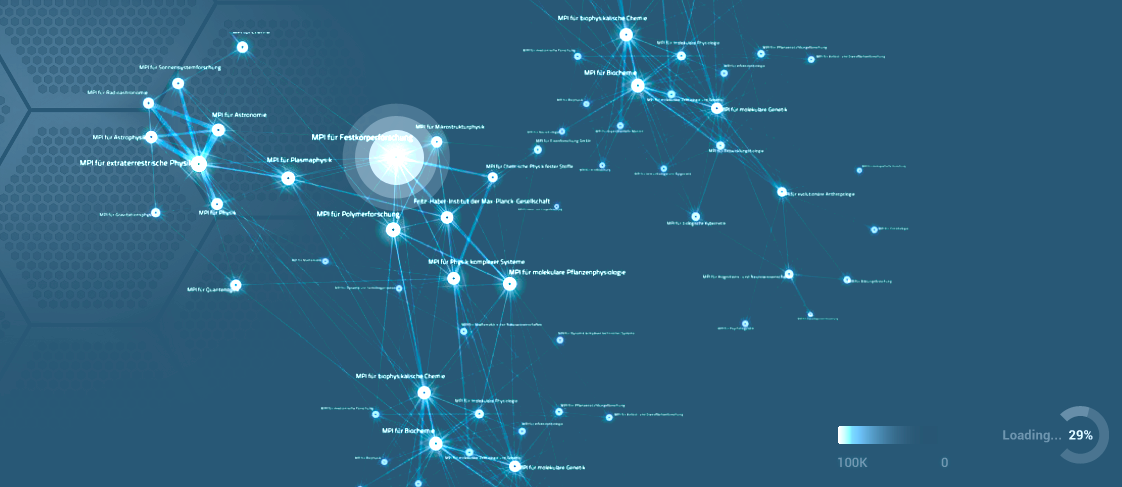
only a portion of the data was given to Gephi

LAN Traffic as seen from a workstation visualized using afterglow and Gephi. To get GDF format file for Gephi use the -k parameter with Afterglow. Thanks Raffy.

I guess tcpdump version 4.6.1 is not compatible with tcpdump2csv.pl hence I got only IPV6 traffic parsed to afterglow.
NEWS UPDATE! Next Visual Analytics Workshop to be held at BlackHat US in August. Join!
Here is part three of the link collection series. The second module of the Visual Analytics Workshop is about Log Data Processing.
Apart from knowing your sed and awk, you want to know these two tools:
- CSVKit - SQL on CSV files anyone?
- LogParser for those of you who use Windows.
And then the rest of the links from this section:
- CommandlineFu
- Regex Lib
- Regular Expressio Information
- Regex One
- RegExr
- Geo Lookup On The Commandline
- Log Analysis Scripts
Advanced PCAP Analysis
- httpry
- dnstop
- Emerging Threats
- HoneySnap
Looking for the previous list of links for the workshop?
- Introductionary Links
- Data Sources
Wanna know more about the visualization workshop? Email me or visit http://pixlcloud.com/training

A view of IPV4 LAN traffic as seen from one of the servers made with tcpdump and pcap using afterglow
NEWS UPDATE! Next Visual Analytics Workshop to be held at BlackHat US in August. Join!
The first module of the Visual Analytics Workshop is about Data Sources.
As a foundation for later visualizations, we need to first understand what the data means. Following are the links of tools and additional material we are going through: (Note that the links might not cover all of the tools in this module. They are merely all the links that show up on the slides.)
Traffic Flows
- Argus
- Argus cool stuff
- NFDump
- NFSen
- Nfsight
- SiLK
- Rayon
- Rayon Presentation
- FlowViewer
Firewalls
- CISCO ASA configuration for NAT logging
- Conntrack for Linux
Threat Intelligence
- STIX
- TAXII
- Cybox
- OpenIOC
- Emerging Threats
- ENISA Report on Threat Intelligence
- Collective Intelligence Framework (CIF)
- ThreatIntelligence
Passive Detection
- P0f
- P0f 3
- Passive DNS
- PRADS
- prads2snort
Host Data
- CollectD
- HekaD
- OSSEC
- Graphite
- StatsD
- Munin
- Ganglia
- RRD
- Logster
Find the previous list of links at the first link collection post.
Wanna know more about the visualization workshop? Email me or visit http://pixlcloud.com/training
NEWS UPDATE! Next Visual Analytics Workshop to be held at BlackHat US in August. Join!
During my Visual Analytics Workshop I mention a ton of tools, Web sites, and projects. Students attending the class get a list of all the links to these items in a summary file.
I decided that the list of links would be something useful for everyone to look at. Over the next few weeks I will be posting all the links on here.
Today we start with a few links of my previous work and the links of the workshop introduction slides:
Raffael Marty:
- Heatmaps - Why is Security Visualization So Hard?
- Cyber Security - How Visual Analytics Unlock Insight
- VizSec 2012 Keynote
- All the Data That's Fit to Visualize
- Security Visualization - Learning From The New York Times
- Mining Your Logs - Gaining Insight Through Visualization
- Application Logging Guidelines
- Visualization Workshops
- PixlCloud
Introduction:
- Binary Visualization Tool (VizBin)
- BinVis
- BinVis Discussion
- Cantor Dust
- Vera
- Periodic Table of Visualizations
- Minard
- Hans Rosling and Gapminder
- Hans Rosling TED talk
- MYO Interface
- Microsoft Kinect
- Leap Motion
- Make It So
Wanna know more about the workshop? Email me.
### VizSec deadline EXTENDED by 1 week! See http://vizsec.org for new schedule. ###
The 11th Visualization for Cyber Security (VizSec) is a forum that brings together researchers and practitioners from academia, government, and industry to address the needs of the cyber security community through new and insightful visualization and analysis techniques. VizSec provides an excellent venue for fostering greater exchange and new collaborations on a broad range of security- and privacy-related topics. VizSec will be held in Paris, France on November 10, 2014 in conjunction with IEEE VIS.
Important research problems often lie at the intersection of disparate domains. Our focus is to explore effective, scalable visual interfaces for security domains, where visualization may provide a distinct benefit, including computer forensics, reverse engineering, insider threat detection, cryptography, privacy, preventing user assisted attacks, compliance management, wireless security, secure coding, and penetration testing in addition to traditional network security. Human time and attention are precious resources. We are particularly interested in visualization and interaction techniques that effectively capture the insights of human analysts so that further processing may be handled by machines, freeing analysts for other tasks. For example, a malware analyst might use a visualization system to analyze a new piece of malicious software that facilitates generating a signature for future machine processing. When appropriate, research that incorporates multiple data sources, such as network packet captures, firewall rule sets and logs, DNS logs, web server logs, and/or intrusion detection system logs, is particularly desirable.
Full papers describing novel contributions in security visualization are solicited. Papers may present techniques, applications, practical experience, theory, analysis, or experiments and evaluations.
Update: Poster are also solicited. Posters may showcase late-breaking results, work in progress, preliminary results, or visual representations relevant to the VizSec community.
More information can be found here.
Big data and security intelligence are the two hot topics in security for 2014. We are collecting more and more information from both the infrastructure, but increasingly also directly from our applications. This vast amount of data gets increasingly hard to understand. Terms like map reduce, hadoop, mongodb, etc. are part of many discussions. But what are those technologies? And what do they have to do with security intelligence? We will see that none of these technologies are sufficient in our quest to defend our networks and information. Data visualization is the only approach that scales to the ever changing threat landscape and infrastructure configurations. Using big data data visualization techniques, you can gain a far deeper understanding of what's happening on your network right now. You can uncover hidden patterns of data, identify emerging vulnerabilities and attacks, and respond decisively with countermeasures that are far more likely to succeed than conventional methods. The attendees will learn about log analysis, big data, information visualization, data sources for IT security, and learn how to generate visual representations of IT data. The training is filled with hands-on exercises utilizing the yet to be released DAVIX 2014 live CD.
Here is what students said about the BlackHat 2013 workshop:
"Raffy obviously put a lot of time and effort into preparing for this course. Having already read the book, I expected a lot of the material to be a re-hash of what I already saw in the book. I was surprised at how much new material there was to get out of it. Looking forward to applying a lot of these concepts in the real world."
"Raffael did a great job! He knows and understands the subject matter extremely well. I highly recommend this course and instructor."
"One of the best trainings I have ever taken!"
Log Analysis
Log Management and SIEM
Visualization
Security Visualization
Tools to gather data:
We are also using a number of visualization tools to analyze example data in the labs:
Under the log management section, we are going to discuss:
The section on big data is covering the following:
Raffael Marty is one of the world’s most recognized authorities on security data analytics. Raffy is the founder and CEO of pixlcloud, the next generation data visualization platform for big data. With a track record at companies including IBM Research and ArcSight, he is thoroughly familiar with established practices and emerging trends in data analytics. He has served as Chief Security Strategist with Splunk and was a co-founder of Loggly, a cloud-based log management solution. Author of 'Applied Security Visualization' and frequent speaker at academic and industry events, Raffy is a leading thinker and advocate of visualization for unlocking insights into data. For more than 14 years, Raffy has lived in the security and log management space to help Fortune 500 companies defend themselves against sophisticated adversaries and train organizations around the world in the art of data visualization for security. Practicing zen has become an important part of Raffy's life.