
Have you noticed? There is a new logo for secviz.org. To be correct this is the first real logo. What was there before wasn't really a logo.
Discussion Entries
SecViz got a new Logo
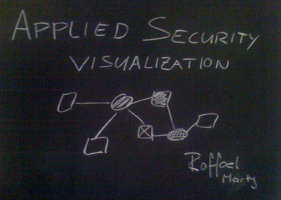
Applied Security Visualization Book is Available!

The Applied Security Visualization book is DONE and available in your favorite store!
You can download an electronic version of Chapter 5 for free! The book also ships with a version of DAVIX, the Data Analysis and Visualization Linux!
Martin McKeay recorded a podcast with me where I talk a little bit about the book.
ISSA Journel - Security Visualization: What you don’t see can hurt you
Russ McRee wrote an article for the ISSA journel where he describes various security visualization approaches. SecViz is prominently featured, as well as a few tools, such as TNV, InetVis, and Rumint. The article also mentions DAVIX. You can read the article here.
In an older article, Russ talked about Argus – Auditing network activity. In that article, he mentions how to use AfterGlow for network traffic analysis.
Applied Security Visualization PodCast from FIRST 2008
At the end of June, during FIRST 2008, Peter Wood and Ben Chai interviewed me about my Applied Security Visualization talk and my book. I really like how the podcast turned out. Tune in!
Applied Security Visualization - FIRST 2008 Talk
 I taught a workshop in Vancouver at the FIRST 2008 conference. I put the slides for the talk about Applied Security Visualization online. It covers parts of the book on the same topic. The outline of the talk looks as follows:
|
|
The podcast discussing the presentation.
VizSec 2008 Call for Posters and Demos
VizSEC 2008 Workshop on Visualization for Cyber Security
http://vizsec.org/workshop2008/
September 15, 2008 / Cambridge, MA USA
In conjunction with RAID 2008
Submission deadlines:
Poster and Demo submissions - July 18, 2008
VizSec is accepting submissions (2 page abstract) for posters and demonstrations. Poster and Demo abstracts will be made available on the VizSec web site.
Posters
Posters can be used to describe work in progress or updates to previously published VizSec research or R&D. Poster submissions should consist of a 2 page abstract. Poster will be presented at the VizSec/RAID reception. Abstracts will be made available on the web site.
Demos
Demonstrations can be used to show new or updated development efforts. Demo submissions should consist of a 2 page abstract. Demonstrations will take place at the VizSec/RAID reception. (You will need to bring a laptop for demos.) Abstracts will be made available on the web site.
New Paper - An approach to malware collection log visualization
I have just published an article related to malware collection log visualization.
The paper focus on visualization of Nepenthes logs using AfterGlow. In the paper you can find information about correlation ips with countries and binary files with ClamAV signatures with the goal of generating interesting graphs.
You can get it at
An approach to malware collection log visualization
Regards
Call for DAVIX Beta Testers
You may have noticed a page on secviz.org called DAVIX. DAVIX is the upcoming live CD for data analysis and visualization, which will be released at Blackhat/DEFCON in Las Vegas in August 2008.
We have prepared the second beta version of DAVIX. Raffael and I are now seeking for beta testers that have the time to test DAVIX and answer the questionnaire that comes along with the beta version.
All completely filled out questionnaires received by me until Monday 23 June 2008 18:00 UTC will enter a raffle for one autographed copy of Raffy's upcoming book Applied Security Visualization. Legal recourse is excluded.
If you want to participate in the beta test please contact: jan.monsch ät iplosion.com
Applied Security Visualization
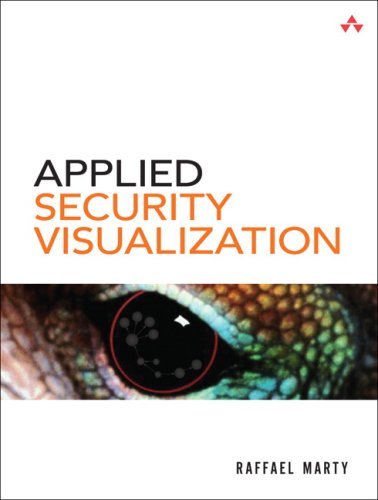 Author: Raffael Marty
Publisher: Addison Wesley Professional
ISBN-10: 0-321-51010-0
ISBN-13: 978-0-321-51010-5
Pages: 552
Publisher Book Home: http://www.informit.com/store/product.aspx?isbn=0321510100
Safari (electronic version): http://safari.informit.com/9780321585530
Marketing Material: Book Flyer
Sample Chapter: Download Chapter 5
Video Interview: Interview with Raffael Marty.
Latest version of DAVIX: http://82.197.185.121/davix/release/davix-latest.iso.gz
“Collecting log data is one thing, having relevant information is something else. The art to transform all kinds of log data into meaningful security information is the core of this book. Raffy illustrates in a straight forward way, and with hands-on examples, how such a challenge can be mastered. Let's get inspired.”
–Andreas Wuchner, Head of Global IT Security, Novartis
Use Visualization to Secure Your Network Against the Toughest, Best-Hidden Threats
As networks become ever more complex, securing them becomes more and more difficult. The solution is visualization. Using today’s state-of-the-art data visualization techniques, you can gain a far deeper understanding of what’s happening on your network right now. You can uncover hidden patterns of data, identify emerging vulnerabilities and attacks, and respond decisively with countermeasures that are far more likely to succeed than conventional methods.
In Applied Security Visualization, leading network security visualization expert Raffael Marty introduces all the concepts, techniques, and tools you need to use visualization on your network. You’ll learn how to identify and utilize the right data sources, then transform your data into visuals that reveal what you really need to know. Next, Marty shows how to use visualization to perform broad network security analyses, assess specific threats, and even improve business compliance.
He concludes with an introduction to a broad set of visualization tools. The book’s CD also includes DAVIX, a compilation of freely available tools for security visualization.
You'll learn how to:
- Intimately understand the data sources that are essential for effective visualization
- Choose the most appropriate graphs and techniques for your IT data
- Transform complex data into crystal-clear visual representations
- Iterate your graphs to deliver even better insight for taking action
- Assess threats to your network perimeter, as well as threats imposed by insiders
- Use visualization to manage risks and compliance mandates more successfully
- Visually audit both the technical and organizational aspects of information and network security
- Compare and master today¿s most useful tools for security visualization
Contains the live CD Data Analysis and Visualization Linux (DAVIX). DAVIX is a compilation of powerful tools for visualizing networks and assessing their security. DAVIX runs directly from the CD-ROM, without installation.
Errata
Here are a few typos and errors that I have found or others have found in the book. Thanks for reporting them (either via email to me or as a comment here).
- Inside cover: My name is mis-spelled (Rafael instead of Raffael)
- Page 15, Figure 1-7: Similarty should be Similarity in the top right of the figure.
- Page 26: Says 172. It should say 127.
- Page 69, under Chart Axes section: "... the vertical axis is generally the y-axis". This should be the z-axis.
- Page 91, Figure 3-22: Arrow from "web" to "10.0.0.252" should be going the other direction.
- Page 162 at the very top: It should mention that there are four, not three subcategories.
- Page 192: line 13 in example: It should be a tilde ~ instead of the [td].
- Index: MADC should be MACD.
Press / Related Material
- February 2010, Directed musings on computers, music, huskies, ...
- November 2009, Applied Security Visualization Utahcon Blot.
- May 2009, Applied Security Visualization Ethical Hacker Network, JP Bourget.
- March 2009, doing more with less … on the SecurityKitchen.
- March 2009, Slashdot mentioning of the book.
- March 2009, Applied Security Visualization blog post by utahcon.
- February 2009, Better security through better visualization by Michael Kelly.
- February 2009, BOOK EXTRACT: Applied security visualization
- January 2009, Richard Austin reviews Applied Security Visualization for IEEE Cipher
- December 2008, iLogin Book Reviews
- December 2008, Book review on Windows IT Pro
- November 2008, Book review on Slashdot
- November 2008, Raffy's Visualization Book Blog post by Anton Chuvakin
- September 2008, Book Review by Adam Shostack
- September 2008, Q&A: Security Visualization Interview with Mirko Zorz
- August 2008, Book Review by Francois Ropert
- August 2008, Security visualization helps make log files work, Article by Robert Westervelt
- August 2008, Security Wire Weekly: Security Visualization, Interview with Robert Westervelt from TechTarget (podcast)
- August 2008, "Networking data visualization not just for pointy-headed bosses", Interview with Michael Morisy.
- August 2008, Book Extract: Networking data visualisation explained
- August 2008, Interview with Martin McKeay at DefCon 2008 (podcast)
- July 2008, Applied Security Visualization at First 2008 (podcast)
- June 2008, Security Visualization: What You Don't See Can Hurt You
- March 2008 SOURCE Boston Blog about "All the data that's fit to visualize" talk.
- January 2008 Bridging Visualization and Security (video)
- January 2008 Applied Security Visualization (video)
- August 2007 Bar Talk about Security Visualization (podcast)
- May 2007 Applied Security Visualization at First 2007 (podcast)
Past events
- "SecViz 007", BCS 2008, Jakarta, November 2008.
- "SecViz 007", IS Summit 2008, Hong Kong, November 2008.
- "Applied Security Visualization" Workshop, IS Summit 2008, Hong Kong, November 2008.
- IT GRC Visualization, Triangle InfoSeCon, Raleigh, North Carolina, October 2008.
- IT Security Awareness Event at University of MichiganL, October 2008.
- "SecViz 007", BA-Con Argentina, Buenos Aires, September 2008.
- Panel discussion at VizSec, Boston, September 2008
- DAVIX presentation at VizSec, Boston, September 2008
- FIT-IT, Graz, Austria, September 2008
- Workshop on Visualization at DefCon, Las Vegas, August 2008
- "Applied Security Visualization" Workshop, First Conference 2008, Vancouver, June 2008
- "Recent Trends in Security Visualization", RSA Conference, San Francisco, April 2008
- "All the Data That's Fit To Visualize", SOURCE Boston, March 2008
Additional Visualization Tools
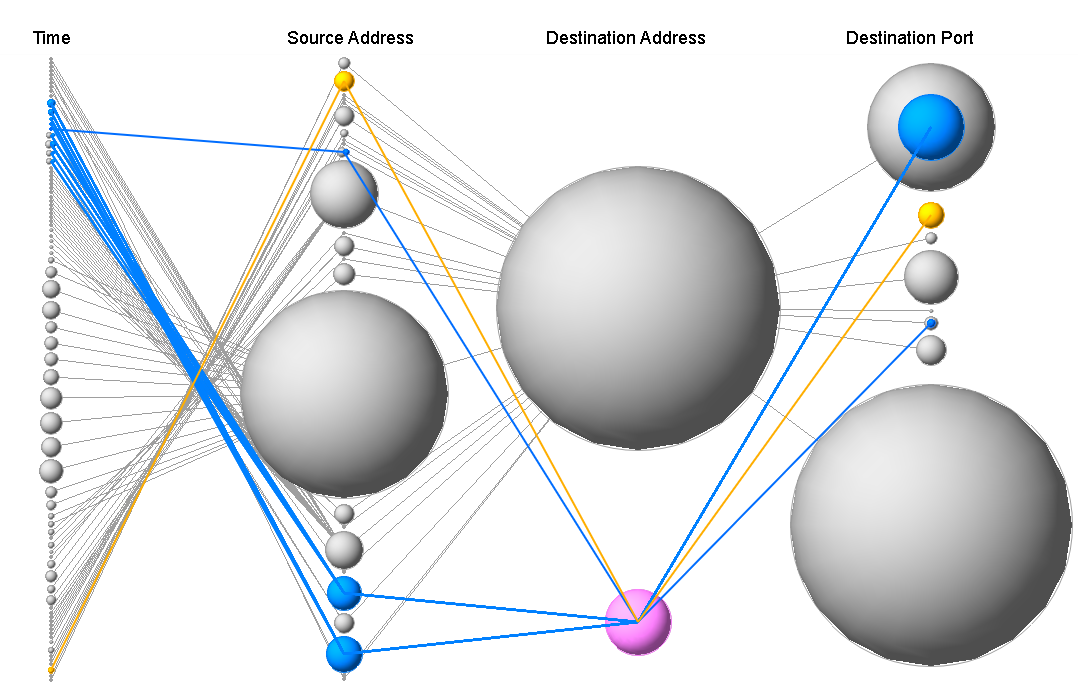
Here is a list of visualization tools. This list is a continuation of what you can find in Chapter 9 "Visualization Tools":
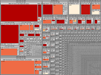
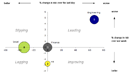
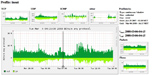
Sample Figures
 |
 |
|
 |
 |
|
 |
 |
|
 |
 |
gltail: cisco asa parser
worked up a cisco asa parser for gltail ( http://www.fudgie.org/ ) to do firewall movies specific to cisco.
I'll submit to the ruby project for gltail, but if anyone wants it email me at jeff@jeffbryner.com.
Applied Security Visualization - Book
Title: Applied Security Visualization
Author: Raffael Marty
Source: Addison Wesley Professional
Publication Date: July 2008 (estimated)
Excerpt:
'....As networks become ever more complex, securing them becomes more and more difficult. The solution is visualization. Using today's state-of-the-art data visualization techniques, you can gain a far deeper understanding of what's happening on your network right now. You can uncover hidden patterns of data, identify emerging vulnerabilities and attacks, and respond decisively with countermeasures that are far more likely to succeed.
In Applied Security Visualization, leading network security visualization expert Raffael Marty introduces all the concepts, techniques, and tools you need to use visualization on your network. You'll learn how to identify and utilize the right data sources, then transform your data into visuals that reveal what you really need to know. Next, Marty shows how to use visualization to perform broad network security analyses, assess specific threats, and even improve business compliance. He concludes with a thorough introduction to DAVIX, today's leading toolset for security visualization.
- Intimately understand the data sources that are essential for effective visualization
- Choose the most appropriate visualization graphs and techniques for your network data
- Walk step-by-step through transforming complex data into crystal-clear visual representations
- Iterate your graphs to deliver even better insight for action
- Assess threats to your network perimeter, as well as threats generated by insiders
- Use visualization to manage risks more successfully
- Visually audit both the technical and organizational aspects of network security
- Compare and master today's most useful tools for network security visualization
Contains the powerful Data Analysis and Visualization UNIX (DAVIX) toolset for visualizing networks and assessing their security. DAVIX runs directly from the CD-ROM, without installation......'
Read the complete article.
VizSec 2008 update
The full and short paper deadline for VizSec has been extended. The new deadlines are:
April 21, 2008 : Deadline for full paper submission
May 19, 2008 : Deadline for short paper submissions
July 18, 2008 : Deadline for poster and demo abstracts
The Keynote speaker at VizSec will be Ben Shneiderman, speaking on the topic Information Forensics: Harnessing visualization to support discovery. Ben Shneiderman is a Professor in the Department of Computer Science, Founding Director (1983-2000) of the Human-Computer Interaction Laboratory, and Member of the Institute for Advanced Computer Studies at the University of Maryland at College Park. He was made a Fellow of the ACM in 1997, elected a Fellow of the American Association for the Advancement of Science in 2001, and received the ACM CHI (Computer Human Interaction) Lifetime Achievement Award in 2001.
Full and short papers will be published by Springer Lecture Notes in Computer Science (LNCS) in the VizSec 2008 Proceedings.
Formatting and submission instructions are on the web site: http://vizsec.org/workshop2008
Google Visualization API - A new Approach to Visualization?
 Google has been working heavily on the visualization front. After acquiring GapMinder, they released various visualization related tools, such as Google Charts. The latest release has been the Google Visualization API (another announcement of the Google Visualization API).
The amount of charts available is fairly impressive. What I really like is the gapminder-like chart. It supports full interaction and is an amazing tool to see how data evolved over time. To see some more of the chart types, have a look at the visualization gallery.
Why is it important to Security Visualization?
I think what is going to happen is that more and more people will get exposed to the capabilities of interactive visualization. This will definitely drive a demand and hopefully trickle down into the world of security visualization. I am definitely looking forward to some interactive tools that assist me in analyzing my log files. Interaction won't be the be all end all solution. I still think security visualization is missing a significant piece. It's the piece where knowledge is translated. People need help visualizing their data. They need help in choosing the right charts, the right colors, etc. It's not easy, but hopefully my upcoming book on "Applied Security Visualization" is going to somewhat help. What is missing is just a translation of the book into a visualization application!
The announcement of the new Google visualization API went out earlier this week and has generated quite a bit of interested in the general community:
- Opening Google Docs to users and developers via Gadgets and Visualization API
- Google Visualization API from Infosthethics
Google is also updating Google Docs to support the new visualization API. Along with the introduction of pivot tables, is this the end of Excel charting? For a walk-through of Google docs and the visualization feature, have a look at Juan Pablo's blog.
The DAVIX Live CD
RELEASED October 2014!
DAVIX, a live CD for data analysis and visualization, brings the most important free tools for data processing and visualization to your desk. Avoid the hassle of installing an operating system or struggling to build and compile the necessary tools to get started with visualization. You can completely dedicate your time to data analysis.
DAVIX 2014 is based on an Ubuntu Server Version 14.04 base image. It is currently only distributed as a VMWare Image. You will therefore need a player to run a Version 9 Virtual Image (either VMPlayer newer than version 5.0 or VMWare Workstation newer than 9.0).
You can also find all the installation scripts on github. These scripts allow you to install DAVIX on a fresh Ubuntu 14.04 Server machine. Or if you wish, you can run the scripts on your existing Ubuntu installation. Be careful though, script number four will harden your machine and remove certain packages, etc. Don't run that on your Desktop.
Documentation and Wiki
The documentation is part of our Wiki.
Reporting Bugs
Please use the github issue tracker to report bugs. This is also where you can see what is still being worked on.
Tools on DAVIX 2014
New Tools in DAVIX 2014
Visualization:
- flowtag
- Gephi
- Google Earth
- ELK Stack
- PicViz
- Update to AfterGlow (1.6.5)
Others:
- dns-browse
- iPython
- netsed
- nsm-console
- PRADS
- R Studio
- rsyslog
- tcpstat
- TeleTrafficTapper
Old Tools from original DAVIX
- AfterGlow
- TreeMap
- Mondrian
- Parvis
- LGL
- R Project
- InteVis
- EtherApe
- GGobi
- Tulip
- Cytoscape
- GUESS
- RT3DG
- Walrus
- Dottty and lneato
- GraphViz
- glTail
- Shoki
- TimeSearcher
- TNV
- NVisionIP
- Rumint
- MRTG/RRD
- GnuPlot
- Ploticus
Visualizations of malware code
An article that passed by me recently that I haven't seen any posts about:
http://blog.washingtonpost.com/securityfix/2008/01/putting_a_scary_face_on_malici_1.html
Brian Krebs wrote it about an artist named Alex Dragulescu, who's doing really interesting visualizations of malware:
http://sq.ro/malwarez.php
VizSEC 2008 Call For Participation
VizSEC 2008 Workshop on Visualization for Cyber Security
http://vizsec.org/workshop2008/
September 15, 2008 / Cambridge, MA USA
In conjunction with RAID 2008
The 5th International Workshop on Visualization for Cyber Security will provide a forum for new research in visualization for computer security. We are pleased to be holding this year's meeting in conjunction with the 11th International Symposium on Recent Advances in Intrusion Detection. The VizSEC Workshop will be held at MIT in Cambridge, Massachusetts USA on Monday, September 15, 2008.
As a result of previous VizSEC workshops, we have seen both the application of existing visualization techniques to security problems and the development of novel security visualization approaches. However, VizSEC research has focused on helping human analysts to detect anomalies and patterns, particularly in computer network defense. Other communities, led by researchers from the RAID Symposia, have researched automated methods for detecting anomalies and malicious activity.
The theme for this year's workshop, which will be held in conjunction with RAID 2008, will be on bridging the gap between visualization and automation, such as leveraging the power of visualization to create rules for intrusion detection and defense systems. We hope that VizSEC participants will stay for the RAID Symposium and RAID participants will consider coming a day early to participate in VizSEC.
We also solicit papers that report results on visualization techniques and systems in solving all aspects of cyber security problems, including:
* Visualization of Internet routing
* Visualization of packet traces and network flows
* Visualization of intrusion detection alerts
* Visualization of attack tracks
* Visualization of security vulnerabilities
* Visualization of attack paths
* Visualization of application processes
* Visualization for forensic analysis
* Visualization for correlating events
* Visualization for computer network defense training
* Visualization for offensive information operations
* Visualization for building rules
* Visualization for feature selection
* Visualization for cryptology
* Visualization for detecting anomalous activity
* Deployment and field testing of VizSEC systems
* Evaluation and user testing of VizSEC systems
* User and design requirements for VizSEC systems
* Lessons learned from development and deployment of VizSEC systems
All submitted papers will be peer-reviewed. Full and short papers from the workshop will be published in an edited book (details to follow).
Full Papers
Full papers should present mature research results. (We will release page count and formatting instructions when we confirm the details of publishing the proceedings.)
Short Papers
Short papers can be used to present less mature research results than full papers, or late-breaking results. (We will release page count and formatting instructions when we confirm the details of publishing the proceedings.)
Demos
Demonstrations can be used to show new or updated development efforts. Demo submissions should consist of a 2 page abstract.
Posters
Posters can be used to describe work in progress or updates to previously published VizSEC research or R&D. Poster submissions should consist of a 2 page abstract.
Deadlines
April 11, 2008 : Deadline for full paper submission
May 9, 2008 : Deadline for short paper submissions
July 11, 2008 : Deadline for poster and demo abstracts
http://vizsec.org/workshop2008/
Very Complex firewall rules?
Hi there,
currently I am searching for a nice tool (OSS/commercial) to do some jobs on my checkpoint firewall rules (cpdb2html generated a 348 page file):
1. Aggregation of rules - Let's say every server in a subnet has ssh enabled then I would like to create ONE rule for the whole environment and remove the dupes.
2. Visualization - I'd like to have a nice graph of my subnets where I can see the hosts and the ports which are openend.
I am no firewall administrator and I only saw the checkpoint GUI once - so maybe I am missing something obvious here.
Anyone?
Thanks and Kind Regards,
Ruediger G. Biernat
Interesting Visualization Research
I came across this presentation from Tamara Munzner. A great read about some of her latest research in visualization. Here are the tools the presentation references. They are really interesting and if you look around on Tamara's Web page, you will find some videos and the tools themselves.
- Accordion Drawing: Tree Juxtaposer and Sequence Juxtaposer (olduvai.sourceforge.net)
- LiveRAC to monitor time-series data (alarms and metrics)
- SessionViewer for log analysis (well, really Web session analysis)
- Glimer, something about multidimensional reductions. Don't ask me how this exactly works
- Grouse, interactive hierarchy exploration
- TopoLayout, Multi-Level Graph Layout by Topological Features
- and some more specialized tools
glTail for realtime logfile visualization
Recently I've stumbled upon this interesting little app called glTail , it's pretty bare at the moment but there's potential.
Cheers
AfterGlow 1.5.9 Released
AfterGlow 1.5.9 is out. It's not a huge release, but it allows for some new things that, for example, Tenshi needed to make it more useful. The feature that helps there is that you can now dynamically change node labels.
Another new feature is the addition of URLs to nodes. This is needed to support image maps. If you generate an image map through GraphViz (-Tcmapx), you can provide URLs that go along with the nodes. If you then use that image map in an HTML file along with the graph, you have an interactive graph. If you are interested in how this looks, I blogged about a Splunk - AfterGlow integration on my Splunk blog. The new search command I built, is using image maps to build an HTML file, which is then linked back to Splunk. Check it out.