Discussion Entries

warning: Creating default object from empty value in /usr/www/users/zrlram/secviz/modules/taxonomy/taxonomy.module on line 1387.

Visual Analytics Workshop - Link Collection Part IV - Log Management and SIEM

NEWS UPDATE! Next Visual Analytics Workshop to be held at BlackHat US in August. Join!

This is the Labor Day issue of the link collection series. The third module of the Visual Analytics Workshop is about Log Management and SIEM.

Looking for the previous list of links for the workshop?

- Introductionary Links
- Data Sources
- Data Processing

Wanna know more about the visualization workshop? Email me or visit http://pixlcloud.com/training

Stay tuned for the next link collection which will be on big data!

Visual Analytics Workshop - Link Collection Part III - Data Processing

NEWS UPDATE! Next Visual Analytics Workshop to be held at BlackHat US in August. Join!

Here is part three of the link collection series. The second module of the Visual Analytics Workshop is about Log Data Processing.

Apart from knowing your sed and awk, you want to know these two tools:

- CSVKit - SQL on CSV files anyone?
- LogParser for those of you who use Windows.

And then the rest of the links from this section:

- CommandlineFu
- Regex Lib
- Regular Expressio Information
- Regex One
- RegExr
- Geo Lookup On The Commandline
- Log Analysis Scripts

- LogParser Studio

Advanced PCAP Analysis

- httpry
- dnstop
- Emerging Threats
- HoneySnap

Looking for the previous list of links for the workshop?

- Introductionary Links
- Data Sources

Wanna know more about the visualization workshop? Email me or visit http://pixlcloud.com/training

Visual Analytics Workshop - Link Collection Part II - Data Sources

NEWS UPDATE! Next Visual Analytics Workshop to be held at BlackHat US in August. Join!

The first module of the Visual Analytics Workshop is about Data Sources.

As a foundation for later visualizations, we need to first understand what the data means. Following are the links of tools and additional material we are going through: (Note that the links might not cover all of the tools in this module. They are merely all the links that show up on the slides.)

Find the previous list of links at the first link collection post.

Wanna know more about the visualization workshop? Email me or visit http://pixlcloud.com/training

Visual Analytics Workshop - Link Collection

NEWS UPDATE! Next Visual Analytics Workshop to be held at BlackHat US in August. Join!

During my Visual Analytics Workshop I mention a ton of tools, Web sites, and projects. Students attending the class get a list of all the links to these items in a summary file.

I decided that the list of links would be something useful for everyone to look at. Over the next few weeks I will be posting all the links on here.

Today we start with a few links of my previous work and the links of the workshop introduction slides:

Raffael Marty:
- Heatmaps - Why is Security Visualization So Hard?
- Cyber Security - How Visual Analytics Unlock Insight
- VizSec 2012 Keynote
- All the Data That's Fit to Visualize
- Security Visualization - Learning From The New York Times
- Mining Your Logs - Gaining Insight Through Visualization
- Application Logging Guidelines
- Visualization Workshops
- PixlCloud

Introduction:
- Binary Visualization Tool (VizBin)
- BinVis
- BinVis Discussion
- Cantor Dust
- Vera
- Periodic Table of Visualizations
- Minard
- Hans Rosling and Gapminder
- Hans Rosling TED talk
- MYO Interface
- Microsoft Kinect
- Leap Motion
- Make It So

Wanna know more about the workshop? Email me.

VizSec 2014 [Deadline Extended]

### VizSec deadline EXTENDED by 1 week! See http://vizsec.org for new schedule. ###

The 11th Visualization for Cyber Security (VizSec) is a forum that brings together researchers and practitioners from academia, government, and industry to address the needs of the cyber security community through new and insightful visualization and analysis techniques. VizSec provides an excellent venue for fostering greater exchange and new collaborations on a broad range of security- and privacy-related topics. VizSec will be held in Paris, France on November 10, 2014 in conjunction with IEEE VIS.

Important research problems often lie at the intersection of disparate domains. Our focus is to explore effective, scalable visual interfaces for security domains, where visualization may provide a distinct benefit, including computer forensics, reverse engineering, insider threat detection, cryptography, privacy, preventing user assisted attacks, compliance management, wireless security, secure coding, and penetration testing in addition to traditional network security. Human time and attention are precious resources. We are particularly interested in visualization and interaction techniques that effectively capture the insights of human analysts so that further processing may be handled by machines, freeing analysts for other tasks. For example, a malware analyst might use a visualization system to analyze a new piece of malicious software that facilitates generating a signature for future machine processing. When appropriate, research that incorporates multiple data sources, such as network packet captures, firewall rule sets and logs, DNS logs, web server logs, and/or intrusion detection system logs, is particularly desirable.

Full papers describing novel contributions in security visualization are solicited. Papers may present techniques, applications, practical experience, theory, analysis, or experiments and evaluations.

Update: Poster are also solicited. Posters may showcase late-breaking results, work in progress, preliminary results, or visual representations relevant to the VizSec community.

More information can be found here.

Visual Analytics Workshop Is Back at BlackHat 2014


VISUAL ANALYTICS – DELIVERING ACTIONABLE SECURITY INTELLIGENCE


BlackHat 2014 - Las Vegas


The Most Popular Visualization Workshop is Back!
Dates: AUGUST 2,3 & 4,5
Location: Las Vegas, USA

SIGN UP NOW


OVERVIEW

Big data and security intelligence are the two hot topics in security for 2014. We are collecting more and more information from both the infrastructure, but increasingly also directly from our applications. This vast amount of data gets increasingly hard to understand. Terms like map reduce, hadoop, mongodb, etc. are part of many discussions. But what are those technologies? And what do they have to do with security intelligence? We will see that none of these technologies are sufficient in our quest to defend our networks and information. Data visualization is the only approach that scales to the ever changing threat landscape and infrastructure configurations. Using big data data visualization techniques, you can gain a far deeper understanding of what's happening on your network right now. You can uncover hidden patterns of data, identify emerging vulnerabilities and attacks, and respond decisively with countermeasures that are far more likely to succeed than conventional methods. The attendees will learn about log analysis, big data, information visualization, data sources for IT security, and learn how to generate visual representations of IT data. The training is filled with hands-on exercises utilizing the yet to be released DAVIX 2014 live CD.

Here is what students said about the BlackHat 2013 workshop:

"Very good course. The trainer really knows the subject matter and has an incredible delivery of the material."

"Raffy obviously put a lot of time and effort into preparing for this course. Having already read the book, I expected a lot of the material to be a re-hash of what I already saw in the book. I was surprised at how much new material there was to get out of it. Looking forward to applying a lot of these concepts in the real world."

"Raffael did a great job! He knows and understands the subject matter extremely well. I highly recommend this course and instructor."

"One of the best trainings I have ever taken!"

SYLLABUS

Log Analysis

  • Data sources
  • Data Analysis and Visualization Linux (DAVIX)
  • Log data processing

Log Management and SIEM

  • Log management and SIEM overview
  • Application logging guidelines
  • Logging as a service
  • Big data - Hadoop, Lucene, ElasticSearch

Visualization

  • Information visualization history
  • Visualization theory
  • Data visualization tools and libraries
  • Visualization resources

Security Visualization

  • Perimeter threat use-cases
  • Network flow data
  • Firewall data
  • IDS/IPS data
  • Proxy data
  • User activity
  • Host-based data analysis


Sample of Tools and Techniques

Tools to gather data:

  • tcpdump and wireshark to analyze packet captures
  • argus, nfdump, nfsen, and silk to process traffic flows
  • snort, bro, suricata as intrusion detection systems
  • p0f, npad for passive network analysis
  • iptables, pf, pix as examples of firewalls

We are also using a number of visualization tools to analyze example data in the labs:

  • graphviz, tulip, cytoscape, and gephi
  • afterglow
  • treemap
  • mondrian, ggobi

Under the log management section, we are going to discuss:

  • rsyslog, syslog-ng, nxlog
  • logstash, graylog
  • commercial log management and SIEM solutions

The section on big data is covering the following:

  • hadoop (HDFS, map-reduce, HBase, Hive, Impala, Zookeper)
  • search engines like: elastic search, Solr
  • key-value stores like MongoDB, Cassandra, etc.
  • OLAP and OLTP


SIGN UP

TRAINER

Raffael Marty is one of the world’s most recognized authorities on security data analytics. Raffy is the founder and CEO of pixlcloud, the next generation data visualization platform for big data. With a track record at companies including IBM Research and ArcSight, he is thoroughly familiar with established practices and emerging trends in data analytics. He has served as Chief Security Strategist with Splunk and was a co-founder of Loggly, a cloud-based log management solution. Author of 'Applied Security Visualization' and frequent speaker at academic and industry events, Raffy is a leading thinker and advocate of visualization for unlocking insights into data. For more than 14 years, Raffy has lived in the security and log management space to help Fortune 500 companies defend themselves against sophisticated adversaries and train organizations around the world in the art of data visualization for security. Practicing zen has become an important part of Raffy's life.

Applications of Mind Mapping automation in the analysis of information security log files

I have started developping applications based on Mind Mapping to help professionals in the analysis of security log files.

My first example, to start with something easy, has been creating a program to analyze Endpoint Protector log files.

Here is a presentation about this issue.

I plan to create more complex applications in case they can be useful to the information security community.

I would like to get feedback about the first impressions about the possibilities of Mind Mapping in Security Visualization.

Visualizing and Cleaning Traffic Logs - Hands On Guide

I have spent quite a bit of time with the VAST 2013 Mini Challenge 1. The given network traffic log is interesting, but bears some challenges. One of them is the ominous source/destination confusion where the network flow collector didn't correctly record the client side of the connection as the source, but recorded it as the destination. That will create all kinds of problems in your data analysis and you therefore have to fix that first.

I wrote a blog entry on Cleaning Up Network Traffic Logs where I am going step by step through the network logs to determine which records need to be turned around. I am using both SQL and some parallel coordinate visualizations to get the job done. The final outcome is this one-liner Perl hack to actually fix the data:

$ cat nf*.csv | perl -F\,\ -ane 'BEGIN {@ports=(20,21,25,53,80,123,137,138,389,1900,1984,3389,5355);
%hash = map { $_ => 1 } @ports; $c=0} if ($hash{$F[7]} && $F[8}>1024)
{$c++; printf"%s,%s,%s,%s,%s,%s,%s,%s,%s,%s,%s,%s,%s,%s,%s,%s,%s,%s,%s",
$F[0],$F[1],$F[2],$F[3],$F[4],$F[6],$F[5],$F[8],$F[7],$F[9],$F[10],$F[11],$F[13],$F[12],
$F[15],$F[14],$F[17],$F[16],$F[18]} else {print $_} END {print "count of revers $c\n";}

Read the full article here: Cleaning Up Network Traffic Logs

If you want to know how to setup a columnar data store to query the network flows, I also wrote a quick step by step guide on loading the network traffic logs into Impala with a Parquet storage engine.

Security Visualization Workshops in Dubai and Seattle Offered by World’s Leading Security Visualization Expert


VISUAL ANALYTICS – DELIVERING ACTIONABLE SECURITY INTELLIGENCE


Big data and security intelligence are the two hot topics in security for 2013. We are collecting more and more information from both the infrastructure, but increasingly also directly from our applications. This vast amount of data gets increasingly hard to understand. Terms like map reduce, hadoop, mongodb, etc. are part of many discussions. But what are those technologies? And what do they have to do with security intelligence? We will see that none of these technologies are sufficient in our quest to defend our networks and information. Data visualization is the only approach that scales to the ever changing threat landscape and infrastructure configurations. Using big data visualization techniques, you can gain a far deeper understanding of what's happening on your network right now. You can uncover hidden patterns of data, identify emerging vulnerabilities and attacks, and respond decisively with countermeasures that are far more likely to succeed than conventional methods. The attendees will learn about log analysis, big data, information visualization, data sources for IT security, and learn how to generate visual representations of IT data. The training is filled with hands-on exercises utilizing the DAVIX live CD.

This class features brand-new material, first presented at BlackHat USA in July 2013. Here is what students said:

"Very good course. The trainer really knows the subject matter and has an incredible delivery of the material."

"Raffy obviously put a lot of time and effort into preparing for this course. Having already read the book, I expected a lot of the material to be a re-hash of what I already saw in the book. I was surprised at how much new material there was to get out of it. Looking forward to applying a lot of these concepts in the real world."

"Raffael did a great job! He knows and understands the subject matter extremely well. I highly recommend this course and instructor."

"One of the best trainings I have ever taken!"


Visual Analytics - Delivering Actionable Security Intelligence

Dates: December 9-10 & 11-12, 2013
Location: Washington State Convention Center
Seattle, Washington, USA
Sign Up Now
Early registration discount ends October 24th!


Network Forensics and Security Visualization

Date: November 3-4, 2013
Location: Dubai, UAW
Sign Up Now


Sample of Tools and Techniques

Tools to gather data:

  • tcpdump and wireshark to analyze packet captures
  • argus, nfdump, nfsen, and silk to process traffic flows
  • snort, bro, suricata as intrusion detection systems
  • p0f, npad for passive network analysis
  • iptables, pf, pix as examples of firewalls

We are also using a number of visualization tools to analyze example data in the labs:

  • graphviz, tulip, cytoscape, and gephi
  • afterglow
  • treemap
  • mondrian, ggobi

Under the log management section, we are going to discuss:

  • rsyslog, syslog-ng, nxlog
  • logstash, graylog
  • commercial log management and SIEM solutions

The section on big data is covering the following:

  • hadoop (HDFS, map-reduce, HBase, Hive, Impala, Zookeper)
  • search engines like: elastic search, Solr
  • key-value stores like MongoDB, Cassandra, etc.
  • OLAP and OLTP


About the Trainer

Raffael Marty is one of the world's most recognized authorities on security data analytics. The author of Applied Security Visualization and creator of the open source DAVIX analytics platform, Raffy is the founder and ceo of PixlCloud, a next-generation data visualization application for big data. With a track record at companies including IBM Research and ArcSight, Raffy is thoroughly familiar with established practices and emerging trends in data analytics. He has served as Chief Security Strategist with Splunk and was a co-founder of Loggly, a cloud-based log management solution. For more than 12 years, Raffy has helped Fortune 500 companies defend themselves against sophisticated adversaries and has trained organizations around the world in the art of data visualization for security. Practicing zen has become an important part of Raffy's life.


SYLLABUS

Log Analysis

  • Data sources
  • Data Analysis and Visualization Linux (DAVIX)
  • Log data processing

Log Management and SIEM

  • Log management and SIEM overview
  • Application logging guidelines
  • Logging as a service
  • Big data technologies

Visualization

  • Information visualization history
  • Visualization theory
  • Data visualization tools and libraries
  • Visualization resources

Security Visualization

  • Perimeter threat use-cases
  • Network flow data
  • Firewall data
  • IDS/IPS data
  • Proxy data
  • User activity
  • Host-based data analysis

How Analytics Enables Security Visualization - Or Not

I was greatly honored when I got an invitation from the Conference on Knowledge Discovery and Data Mining (KDD) to give a talk about data mining and cyber security.

Knowing me, you might be able to guess the topic I chose to present: Visual Analytics. I am focussing on not the visualization layer or the data layer, but on the analytics layer. In the presentation I am showing what we have been doing with data analytics and data mining in cyber security. The presentation starts out with an overview of what security is and what our data looks like. While I show a few examples for different areas in cyber security, I am mainly highlighting problems and challenges we have been facing within these areas with regards to analytics and data mining.

The presentation has 5 parts:

  • Cyber Security - Lay of the Land: A quick introduction to the information / cyber security field.
  • Data Mining in Security: For the data scientists out there, how does security data look like and what are some of the challenges you will face when dong data mining on security data (see slide below).
  • Visual Analytics: This section discusses why is visual analytics a promising approach to the security data problem?
  • Security Visualization: In three areas I am showing examples of visualization that we are using in the security field. I also outline the problems we are facing with the approaches.
  • Challenges: This is a summary of some of the challenges we have in security data analytics. See below.

For each of the six areas in data mining, the following slide shows a couple of challenges that one will run into when trying to apply them to cyber security data:

Security Visualization Challenges

At the end, I am presenting a number of challenges to the community; hard problems that we need help with to advance insights into cyber security of infrastructures and applications. The following slide summarizes the challenges I see in data mining for security:

Definitely not a complete list. Please comment and add other challenges! If you have any suggestions on solving the challenges, please contact me or comment on this post as well!

DAVIX Survey - Your Input is Needed

We are preparing for the next DAVIX release and have constructed a survey to get your input on the tools you would like included, the delivery mechanism, and general information on your security visualization needs. Your participation in the survey would be greatly appreciated!

The survey is located at http://www.surveymonkey.com/s/769KG3C.

We would like to collect all responses by July 31, 2013.

AfterGlow Slide Deck

AfterGlow to GephiI recently released a short slide deck on AfterGlow.

AfterGlow is a security 'visualization' tool that simplifies the task of creating network graphs. It reads CSV files and converts them into a graph representation based on a set of configurations that the user defines (colors, edge thickness, node sizes, clustering, etc.). AfterGlow is a pretty powerful tool and filly this slide deck summarizes the features and provides a couple of interesting examples of how to use the tool.

These slides will also be part of my Visual Analytics workshop during BlackHat at the end of the month. There are still a couple of seats available!

VizSec 2013 - Paper Deadline Extended, Poster Deadline Announced

The 10th Visualization for Cyber Security (VizSec) will be held in Atlanta GA, USA on October 14, 2013 in conjunction with IEEE VIS. VizSec brings together researchers and practitioners in information visualization and security to address the specific needs of the cyber security community through new and insightful visualization techniques.

The paper deadline has been extended to July 22, 2013 at 5:00pm PDT. Full papers offering novel contributions in security visualization are solicited. Papers may present techniques, applications, practical experience, theory, analysis, or experiments and evaluations. We encourage papers on technologies and methods that promise to improve cyber security practices, including, but not limited to:

  • Situational awareness / understanding
  • Incident handling including triage, exploration, correlation, and response
  • Computer forensics
  • Recording and reporting results of investigation
  • Reverse engineering and malware analysis
  • Multiple data source analysis
  • Analyzing information requirements for computer network defense
  • Evaluation / User testing of VizSec systems
  • Criteria for assessing the effectiveness of cyber security visualizations (whether from a security goal perspective or a human factors perspective)
  • Modeling system and network behavior
  • Modeling attacker and defender behavior
  • Studying risk and impact of cyber attacks
  • Predicting future attacks or targets
  • Security metrics and education
  • Software security
  • Mobile application security
  • Social networking privacy and security
  • Cyber intelligence
  • Human factors in cyber security

We are also soliciting posters. Poster submissions may showcase late-breaking results, work in progress, preliminary results, or visual representations relevant to the VizSec community. Accepted poster abstracts will be made available on this website. Poster submissions are due August 23, 2013 at 5:00pm PDT.

See vizsec.org for the full Call for Papers and additional details.

VAST Challenge 2013 Now Available

This year's IEEE VAST Challenge features two mini-challenges that particularly appeal to the SecViz community. These challenges are open to participation by individuals and teams in industry, government, and academia. Creative approaches to visual analytics are encouraged.

Mini-Challenge 2 tests your skills in visual design. The fictitious Big Enterprise is searching for a design for their future situation awareness display. The company's intrepid network operations team will use this display to understand the health, security, and performance of their entire computer network. This challenge is also very different from previous VAST Challenges, because there is no data to process and no questions to answer. Instead, the challenge is to show off your design talents by producing a creative new design for situation awareness. Please visit http://www.vacommunity.org/VASTchallenge2013MC2 for more information.

Mini-Challenge 3 focuses on unusual happenings on the computer network of a marketing company. Can you identify what looks amiss on the network using the network flow and network health data provided? And can you ask the right questions to help you piece together the timeline of events? Two weeks of data will be released for this challenge. Week 1 data is now available. Please visit http://www.vacommunity.org/VASTchallenge2013MC3 for more details.

For more information, please contact vast_challenge@ieeevis.org

Visual Analytics Workshop With World's Leading Security Visualization Expert


VISUAL ANALYTICS – DELIVERING ACTIONABLE SECURITY INTELLIGENCE


BlackHat Las Vegas


only a few seats left!
Dates: JULY 27-28 & 29-30
Location: Las Vegas, USA
SIGN UP NOW

OVERVIEW

Big data and security intelligence are the two hot topics in security for 2013. We are collecting more and more information from both the infrastructure, but increasingly also directly from our applications. This vast amount of data gets increasingly hard to understand. Terms like map reduce, hadoop, mongodb, etc. are part of many discussions. But what are those technologies? And what do they have to do with security intelligence? We will see that none of these technologies are sufficient in our quest to defend our networks and information. Data visualization is the only approach that scales to the ever changing threat landscape and infrastructure configurations. Using big data data visualization techniques, you can gain a far deeper understanding of what's happening on your network right now. You can uncover hidden patterns of data, identify emerging vulnerabilities and attacks, and respond decisively with countermeasures that are far more likely to succeed than conventional methods. The attendees will learn about log analysis, big data, information visualization, data sources for IT security, and learn how to generate visual representations of IT data. The training is filled with hands-on exercises utilizing the DAVIX live CD.

SYLLABUS

Log Analysis

  • Data sources
  • Data Analysis and Visualization Linux (DAVIX)
  • Log data processing

Log Management and SIEM

  • Log management and SIEM overview
  • Application logging guidelines
  • Logging as a service
  • Big data technologies

Visualization

  • Information visualization history
  • Visualization theory
  • Data visualization tools and libraries
  • Visualization resources

Security Visualization

  • Perimeter threat use-cases
  • Network flow data
  • Firewall data
  • IDS/IPS data
  • Proxy data
  • User activity
  • Host-based data analysis


TRAINER

Raffael Marty is one of the world's most recognized authorities on security data analytics. The author of Applied Security Visualization and creator of the open source DAVIX analytics platform, Raffy is the founder and ceo of PixlCloud, a next-generation data visualization application for big data. With a track record at companies including IBM Research and ArcSight, Raffy is thoroughly familiar with established practices and emerging trends in data analytics. He has served as Chief Security Strategist with Splunk and was a co-founder of Loggly, a cloud-based log management solution. For more than 12 years, Raffy has helped Fortune 500 companies defend themselves against sophisticated adversaries and has trained organizations around the world in the art of data visualization for security. Practicing zen has become an important part of Raffy's life.

SIGN UP

Evaluating Security Visualizations in Supporting Analytical Reasoning & Decision Making in Cybersecurity

In conjunction with the 2013 IEEE International Conferences on Intelligence and Security Informatics (ISI), we present a special topics workshop on:

Evaluating Security Visualizations in Supporting Analytical Reasoning & Decision Making in Cybersecurity

Workshop Description
As the potential for visualizations in cybersecurity analysis becomes exceedingly more apparent, efforts to evaluate these visualizations become more imperative than ever to supporting the cybersecurity mission. As technology and big data continue to grow rampantly so does the deployment of insufficiently evaluated cybersecurity visualizations that claim to be most aligned with how analysts think and perceive data. Before organizations may intelligently incorporate visualization into their cybersecurity analysis process they must be prepared to pose tailored sets of questions that directly relate to the particular objective of the cyber analyst. This workshop addresses these gaps with the intent of bringing together experts from a variety of disciplines relevant to the topic of evaluating cybersecurity visualizations in their ability to support analytic reasoning and decision making in cybersecurity.

Paper Topics
We welcome paper submissions on the following or related topics:

Empowering the Human Analysts
Methods and techniques for evaluating the impact cybersecurity visualizations have on enabling the human perception and cognitive processes that are required for intelligent decision making.

Addressing current deficiencies in cybersecurity analysis
Methods and techniques for measuring the impact cybersecurity visualization tools have on addressing current deficiencies that still exist in cybersecurity analysis such as exploration and prediction.

The Unique nature of Cybersecurity Visualization
Identifying aspects that are specific to cybersecurity visualization, and identifying relevant contributions from current research in the broader fields of information visualization and scientific visualization, and from visualizations in other domains.

Important Dates

Workshop papers due: March 31, 2013
Notices of acceptance and comments provided to authors: April 12, 2013
Camera ready paper submitted: April 29, 2013

Website: http://www.isiconference2013.org/pgs/workshop-on-cybersecurity-visualizations.php

Paper Submission:
Submission file formats are PDF and Microsoft Word. Required Word/LaTex templates (IEEE two-column format) can be found on IEEE's Publications web pages. Submissions can be long (6,000 words, 6 pages max) or short (3000 words, 3 pages max). Papers in English must be submitted by email to Lisa Coote at Lisa.Coote@innovative-analytics.com. The accepted workshop papers from will be published by the IEEE Press in formal Proceedings. Authors who wish to present a poster and/or demo may submit a 1-page extended abstract, which, if selected, will appear in the conference proceedings.

Conference content will be submitted for inclusion into IEEE Xplore as well as other Abstracting and Indexing (A&I) databases. The selected IEEE ISI 2013 best papers will be invited for contribution to the Springer Security Informatics Journal.
Organizing Committee:

Kevin O'Connell, Innovative Analytics & Training
Lisa Coote, Innovative Analytics & Training

Program Committee:

Raffael Marty, PixlCloud
Tomas Budavari, John Hopkins University
Antonio Sanfilippo, Pacific Northwest National Laboratory
John T. Langton, VisiTrend LLC
Claudio Silva, NYU Polytechnic
Bernice Rogowitz, Visual Perspectives Consulting
Cullen Jackson, APTIMA
Enrico Bertini, NYU Polytechnic
John Goodall, Oak Ridge National Laboratory

VizSec 2013

VizSec 2013 will be held in Atlanta, Georgia on October 14, 2013 in conjunction with IEEE VIS. Paper submissions are due July 8, 2013 and poster abstracts are due August 23, 2013.

The 10th International Symposium on Visualization for Cyber Security (VizSec) is a forum that brings together researchers and practitioners from academia, government, and industry to address the needs of the cyber security community through new and insightful visualization and analysis techniques. VizSec will provide an excellent venue for fostering greater exchange and new collaborations on a broad range of security- and privacy-related topics. Accepted papers will appear in the ACM Digital Library as part of the ACM International Conference Proceedings Series.

Important research problems often lie at the intersection of disparate domains. Our focus is to explore effective, scalable visual interfaces for security domains, where visualization may provide a distinct benefit, including computer forensics, reverse engineering, insider threat detection, cryptography, privacy, preventing 'user assisted' attacks, compliance management, wireless security, secure coding, and penetration testing in addition to traditional network security. Human time and attention are precious resources. We are particularly interested in visualization and interaction techniques that effectively capture human analyst insights so that further processing may be handled by machines, freeing the analyst for other tasks. For example, a malware analyst might use a visualization system to analyze a new piece of malicious software and then facilitate generating a signature for future machine processing. When appropriate, research that incorporates multiple data sources, such as network packet captures, firewall rule sets and logs, DNS logs, web server logs, and/or intrusion detection system logs, is particularly desirable.

See http://www.vizsec.org/ for additional information.

Security Visualization Events

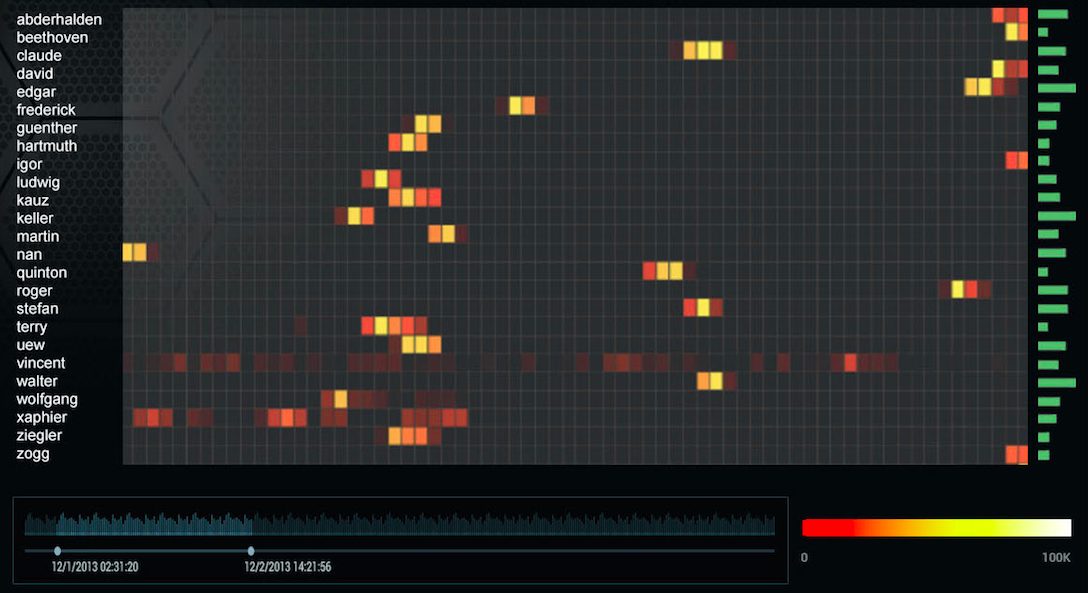
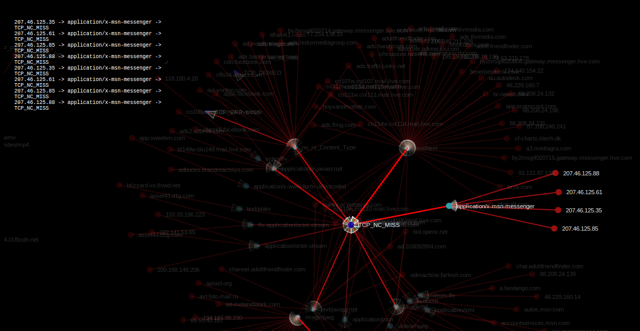
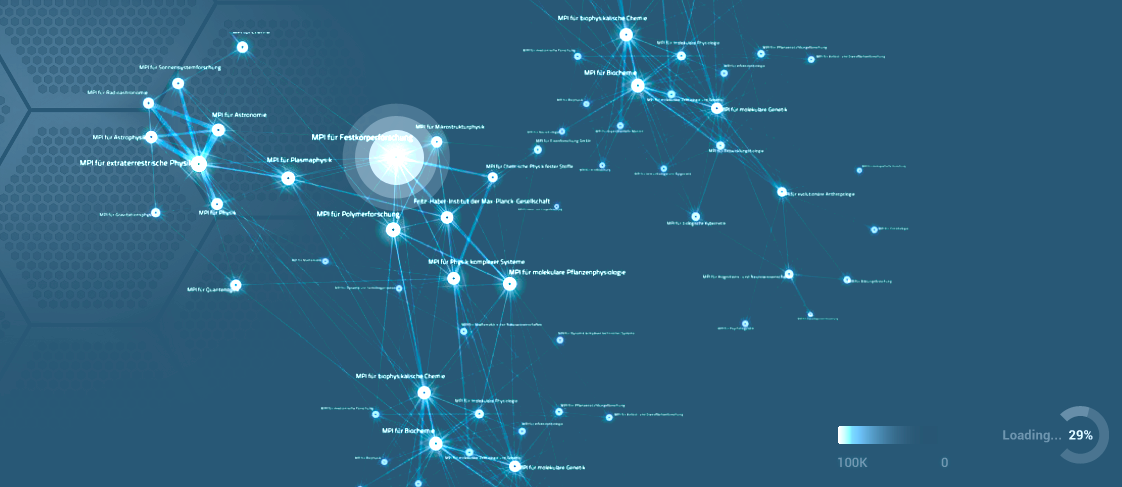
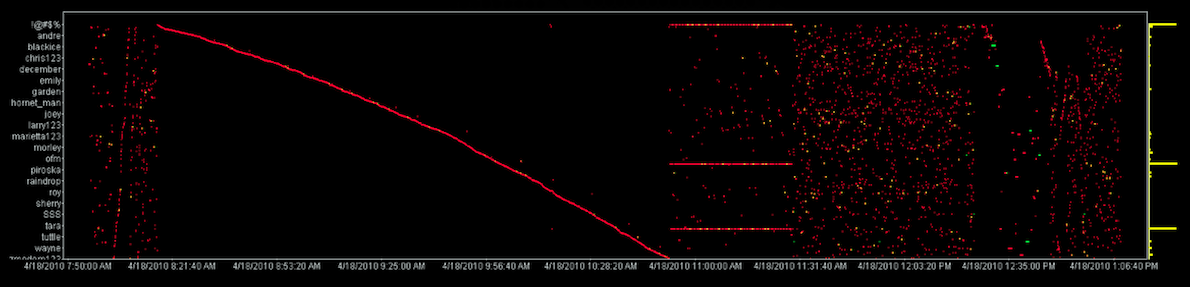
In December I'll be presenting on security intelligence and the interplay of visualization and data mining.

I wrote a blog post that introduces the talk in Palo Alto a little bit. It's about Supercharging Visualization with DataMining. Check it out and make sure you RSVP for the event tomorrow.

Security Visualization Training in Dubai

There are a couple of seats open for next week's security visualization workshop in Dubai. The training is held Friday and Saturday, November 9th and 10th in Dubai.

The topics are anything from data sources to log processing to a lot of eye-catching visualizations, and a great module on big data. The signup link contains all the information you need.

Hope to see you in Dubai next week!

VizSec 2012 - Keynote

A week ago, in Seattle, VizSec 2012 was taking place. I had the honor to present the keynote, which I used as an opportunity to talk about the state of the security visualization space. Here is the video of the talk.

This is a quick outline of the talk:

  • Security visualization - The most exciting field
  • The vision - This section talks about some of the challenges that we have in security visualization and what I would like to see in a security visualization application. Well, some of what I would like to see, there are some parts I left out and will hopefully deliver through pixlcloud in the not so far future.
  • Why is security visualization so hard? I am talking about a few reasons why we have such a hard time with visualizing security data. One of the issues is that we are different; security visualization is different from all the other fields out there. We have problems and data that no other area deals with. We have a lot of IP addresses, for example or port numbers. If we try to work with other domain experts, for example from the data mining space, they don't understand our data well enough to build good algorithms. One very common problem are 'distance functions'. They are incredible hard to define and because our data is mostly categorical and not numerical, that presents a significant problem. I also see port numbers being treated as continuous variables, which is just plain wrong.
  • Security analysts - I am providing a little bit of a provocative view of security analysts. There is no defined way of analyzing security data and therefore, every analyst is doing his/her work differently. If we try to build a tool for any one of them, the next one might not be able to use it at all.
  • Visualizing big data - I am offering a little bit of an answer on how to visualize a large amount of data. It all comes back to Ben Shneiderman with his information seeking mantra.
  • Data mining - I have been looking into data mining a lot lately. I am trying to define what the right interplay between data mining and visualization is. Either of the disciplines alone won't solve our problems. Together they can unlock a lot of insights, however. But don't be fooled. Data mining is super hard to get right.
  • Moving forward - I quickly outline what's going on out there. Visualization contests seem to gain popularity. I close with my challenge to everyone of solving the many problems that we still face. If you are a researcher, have a look at this slide and help us solve some of the problems.
    • Following are the slides from the talk. Unfortunately, my video recording from the VizSec keynote failed. I was presenting at Microsoft however, the same week and I was able to record my talk there. Same slides.