

Mid March I taught a Log Analysis and Visualization class in Taipei, Taiwan. I had a total of about 35 students spread over two classes, each of them lasting for two days.
The first part of the workshop focused on the application and use of log analysis with a number of tools. We looked at Splunk with topics like advanced searches, lookups, and alerting. We then looked at Loggly and learned how to use the logging service to analyze logs and build mashups against it.
The remainder of the workshop explored the world of data analysis and visualization. Using today's state-of-the-art data analysis and visualization techniques, we looked at how we can gain a far deeper understanding of what's happening in our networks. How can visualization techniques be applied to understand packet captures or network flows instead of just producing pretty pictures? We explored how to uncover hidden patterns of data, identify emerging vulnerabilities and attacks, and respond decisively with countermeasures that are far more likely to succeed than conventional methods. As part of the workshop we looked at the insider threat problem and had a brief look at how host-centric (as opposed to network centric) analysis can help completing the picture of an incident.
The entire workshop is based on open source tools, such as AfterGlow or Treemap. The attendees got an overview of log aggregation, log management, visualization, data sources for IT security, and learned how to generate visual representations of log data. The workshop was accompanied by hands-on exercises utilizing Splunk, Loggly, and the DAVIX live CD.
The following is the agenda of the entire two days:
Day 1 - Log Analysis
- Section 1: Data Sources
- Section 2: Data Analysis and Visualization Linux (DAVIX)
- Section 3: Log Management and Analysis
- Section 4: Log Data Processing
- Section 5: Splunk Introduction
- Section 6: Splunk Data Analysis
Data analysis relies on data. This section discusses a variety of data sources relevant to computer security. I show what type of data the various devices generate, show how to parse the data, and then discuss some of the problems associated with each of the data sources.
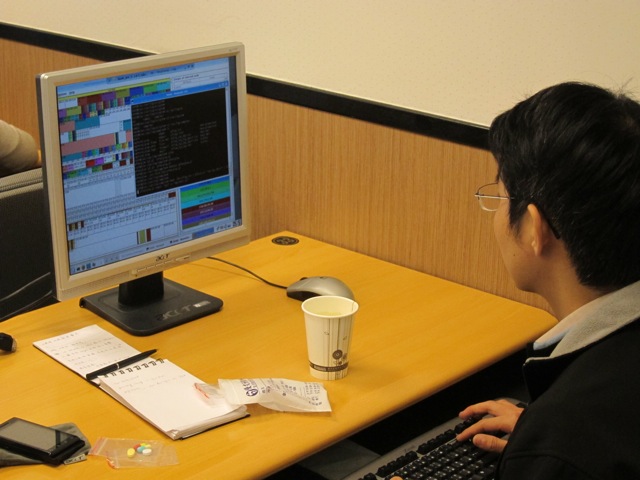
DAVIX is a Linux distribution that is used to analyze log data. This class is using the latest version that also has Splunk installed to provide an environment for the students to work on the exercises.
This section is giving an introduction to log management concepts, such as aggregation, parsing, connectors and agents, log archiving, and correlation. The logging landscape has drastically changed in the last years. We will see where things are at, how the cloud has changed log management, and what tools are being used nowadays. This will cover not only some of the commercial tools, such as Loggly, but also show a number of open source log management tools, such as Snare, syslog-ng, and rsyslog.

In order to make log data actionable, the data has to be manipulated and transformed into a form that can be processed by analysis tools. I will be showing a variety of methods (e.g., regular expressions, UNIX commands) to process logs.
This section on Splunk is going to give an introduction to the Splunk log analysis capabilities with an overview of different data processing methods, such as input configurations, field extractions, the use of event types, and application of tagging for event data.
Once Splunk is setup to receive data and it processes the data correctly, we can start to analyze the data. This section is going into the topics of running statistics on the data, summary indexing, trend reporting, using regular expressions for searching, etc.

Day 2 - Visualization
- Section 1: Visualization
- Section 2: Data Visualization Tools
- Section 3: Perimeter Threat
- Section 4: Host-based Security Analysis with Splunk
- Section 5: Packet Capture Analysis with Splunk
This section introduces some basic visualization concepts and graph design principles that help generate visually effective graphs. It also gives an overview of graphs like treemaps, link graphs, or parallel coordinates, and how they can be used to visualize data.

After a short introduction to different data formats used by visualization tools, this section then discusses visualization tools and libraries. The Data Visualization and Analysis UNIX (DAVIX) distribution will be used to show most of the visualization tools. I will show how simple it is to generate visual representations of log data and how tools can be leveraged to visualize information. The theory is then backed by a number of exercises that allow the students to deepen the understanding of the tools and methods.
This section is a collection of use-cases. It starts out with a discussion of use-cases involving traffic-flow analysis. Everything from detecting worms to isolating denial-of-service attacks and monitoring traffic-based policies is covered. The use-cases are then extended to firewall logs, where a large firewall ruleset is analyzed first. In a second part, firewall logs are used to assess the ruleset to find potential misconfigurations or security holes. Intrusion detection signature tuning is the next two use-case. The remainder of the section looks at application layer data. Email server logs are analyzed to find open relays and identify email-based attacks. The section closes with a discussion of visualizing vulnerability scan data.
A topic often forgotten in security data analysis is the treatment of host-based logs. There is a great amount of information that can be collected directly on end systems. This information can be invaluable in forensic investigations. This section explores what these data sources are and how they can be used. In addition, this section will show how this data can be cross-correlated with network-based data.

Packet captures are a very common and rich data source to identify attacks and understand the details of attacks. This section is going to explore how Splunk can be used to analyze packet captures effectively.