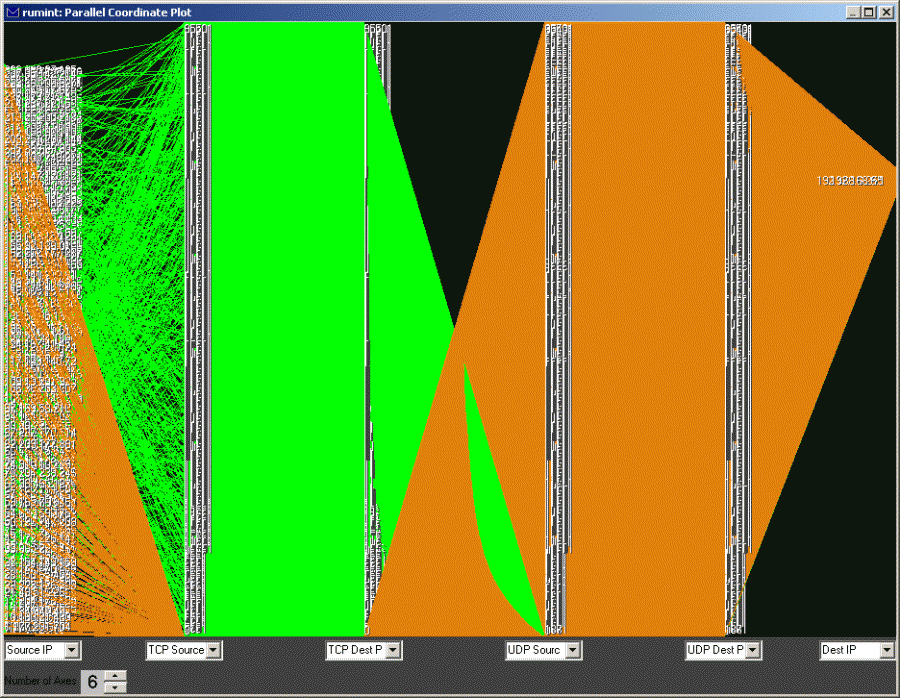
This is an image of a parallel coordinate plot (source IP, source TCP port, destination TCP port, source UDP port, destination UDP port, destination IP) that I created using the rumint visualization tool. TCP is in green and UDP is in orange. I deliberately jammed the visualization display by creating packets with random source IP addresses and sequential source and destination ports. If you are interested in more details they are available in this paper [PDF].

